
Meetings and events represent significant investments for participants.
Attendees must invest their time and possibly registration money. Exhibitors must invest time and money to reach the attendees. And meeting planners must invest in reserving the right amount of meeting and exhibit space and also ensure attendee flow is conducive to productive business engagements or learning experiences.
Although heat mapping visual representations have been around for a century or more in various forms, the digital revolution and data analytics have made this tool extremely useful and utilized in the last decade. A frequent use of heat maps in the events industry is to track attendee behavior.
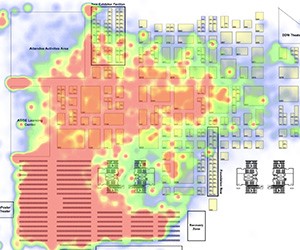
So, what are heat maps? Very basically, heat maps are a data analyzation tool that uses colors on a warm-to-cool spectrum to show the popularity of something, be it the number of visits different elements of a website attracts or the flow of traffic to specific areas of an exhibit floor.
If you’re seeing a lot of red, you’re doing something right. Blue? Not so much.
Real-Time Heat Mapping Application
 According to Meredith Meller, client relationship manager and educator for ATIV Software, and Deidra Crawford, industry sales and operations director for Digestive Disease Week (DDW), although the use of heat maps in the meetings, exhibitions and events arena can be a revenue booster, the idea still hasn’t “caught fire” in the industry.
ATIV published a case study of the use of heat maps during DDW's annual meeting over three years: 2016 in San Diego, at the San Diego Convention Center; 2017 in Chicago, at McCormick Place; and 2018 in Washington, D.C., at the Walter E. Washington Convention Center. The meetings attracted approximately 14,000 attendees and 300 exhibitors per year.
“One [essential] thing I’ve noticed over these last few months working on this case study is a lot of meeting planners really don’t know why they need traffic heat maps,” Meller said. “It’s this cool new thing and they don’t know how to use it."
The organizers of DDW were looking for a data-driven solution to maximize the event’s floor plan. One key measurement task involved examining the flow and visibility of the approximately 1,000 poster boards that detailed the latest research in the field.
According to the case study, DDW had already used RFID- and Wi-Fi-based tracking solutions but found them to be too expensive and time-consuming to implement.
DDW chose to ATIV’s EventPilot heat mapping software. The conference had previously used the software suite for indoor positioning and navigation in its expo and poster hall but decided to utilize heat mapping to get a real-time visualization of traffic so organizers could make decisions on the fly.
“The indoor positioning model was used to move attendees around the exhibit hall—like a Google map for indoors,” Meller said. “That was the module that DDW was using to help their attendees around the expo hall, so the traffic heat map was the bonus for meeting planners to have that data as well.”
According to the case study, RFID and Wi-Fi tracking solutions can present the following challenges:
- RFID required high additional expenses, such as tens of thousands of dollars for electrical service just to monitor entrance ways.
- Each entrance required three readers to track attendee badges, which also had to be placed into badge holders ahead of time, requiring additional labor costs and staff time.
- The RFID solution did not provide traffic-flow, attendee behavior and dwell-time data.
- Although less expensive, Wi-Fi tracking was not available in real time, and did not differentiate between attendees, exhibitors or staff.
How to Use Heat Maps for Meetings
 According to Crawford, the use of EventPilot’s heat mapping software for the three annual DDW meetings was successful in a number of key areas.
“For right-sizing rooms; [DDW] is very topic driven, and we don’t ask them to pre-register for each session, so it would help them discover which topics are popular and to look at right-sizing rooms if they had that data from year to year,” Crawford said, adding that, as expected, heat mapping data showed the research poster area of the exhibit area attracted the most traffic.
“We realigned the location for our posters and we wanted to see how that affected traffic flow in the hall,” Crawford said. “And secondary, I wanted help to redesign the floor so people can move around more, and thirdly, what are planners doing to get traffic to their booth?
“Are they doing something special? Are they serving food?”
According to ATIV, the use of heat mapping software for DDW resulted in the following benefits:
- A savings of 62% in event technology expenses.
- It unveiled unexpected traffic flow data and allowed organizers to adjust staff needs in real time.
- It identified high-traffic booth spaces for its sales team to possibly sell at a premium.
The DDW case study found that some of the most actionable data came from areas suffering from low traffic.
“The really big thing you’ll find in the case study is a situation of an area that didn’t have interest,” Crawford said. “On the first day there was a lot of heat mapping traffic in an area that didn’t have an entrance, so a few hours after opening we made it an entrance, and from a security perspective it allows me to open it up.”
Meller added heat mapping software can greatly aid in upselling exhibitors.
“You could potentially increase ROI,” Meller said.
“We have some other people that are using traffic heat maps that are considering pricing booths differently based on primary booth space<” she added. “And you can sell gamification, saying, ‘You participated in the game this year and you had more traffic than the year you didn’t participate.'"
Click on the text links to download EventPilot’s DDW Case Study and PowerPoint presentation that were shared with attendees at Smart Monday powered by MPI at IMEX America 2018.