
There’s a reason the IMEX team encourages attendees to share their thoughts and photos from the show floor using the hashtag #IMEXcited.
There is arguably nothing that compares to the excitement one feels at the show, whether it comes from connecting with industry colleagues, learning about the latest industry news or hearing the business events outlook for next year is positive—especially for the “I” in “MICE.”
The incentives sector of the meetings and events industry has been making a slow and steady comeback following the pandemic, with planners typically choosing to host incentive events in “safe” destinations the past few years while getting back into the swing of things and with budgets being lower than usual.
Now, based on results from this year’s Incentive Travel Index (ITI), it’s safe to say incentives are back and better than ever.
As SITE CEO Annette Gregg likes to put it, “We’re alive in 2025!”
What Is the Incentive Travel Index?

For the past seven years, the Society for Incentive Travel Excellence (SITE) and the Incentive Research Foundation (IRF) have partnered with Oxford Economics to release an annual study highlighting the current state of the global incentive travel market.
The ITI has quickly become one of the business events industry’s most authoritative annual reports on how the incentive travel market impacts companies, agencies and destinations each year.
Results from this year’s ITI were launched during MPI’s Smart Monday ahead of IMEX America at Mandalay Bay in Las Vegas. The launch came alongside a panel discussion that was jointly moderated by IRF’s Stephanie Harris and SITE’s Pádraic Gilligan, with an expert panel including Hilton’s Maggie Worthington, Destination Canada’s Jennifer Attersall, Nationwide’s Patricia Kerr and Bishop McCann’s Justin Myers providing commentary on the results.
Highlights of the report were broken into four main sections, each focusing on a different aspect of the incentive travel segment, including growth and budgets, program inclusions, challenges ahead and destination selection.
Here’s a breakdown of the biggest takeaways from the data, specifically in relation to North America-based planners.
[Related: The Latest Incentive Travel Trends With Maritz's Casey Epley]
Who Was Surveyed?
The ITI report surveyed 2,852 total incentive travel industry professionals representing 19 industry verticals and 85 countries, a marked increase from 2023’s 2,464 respondents. The survey was conducted May-July 2024 and included five distinct incentive travel roles: incentive travel end-users, incentive travel agencies, destination management companies (DMCs), suppliers (hotels, cruise lines, venues) and destination marketing organizations (DMOs).
The survey was made up of 58% sellers, which included suppliers, DMCs and DMOs, and 42% buyers, which included incentive travel house and incentive travel program owners. Of the 2,852 respondents, 32% identified as incentive travel house, 24% as suppliers to the incentive market and 22% as representatives of destination management companies.
North America was the largest location represented in the survey, with 41.5% of respondents saying they were based in North America, 20% based in Europe and 18% from Asia-Pacific. The finance, insurance and tech industries were among the primary industries for incentive travel programs, with finance and insurance being ranked as one of the most important industries by over three-quarters of respondents.
Incentive Travel Growth and Budget Allocation
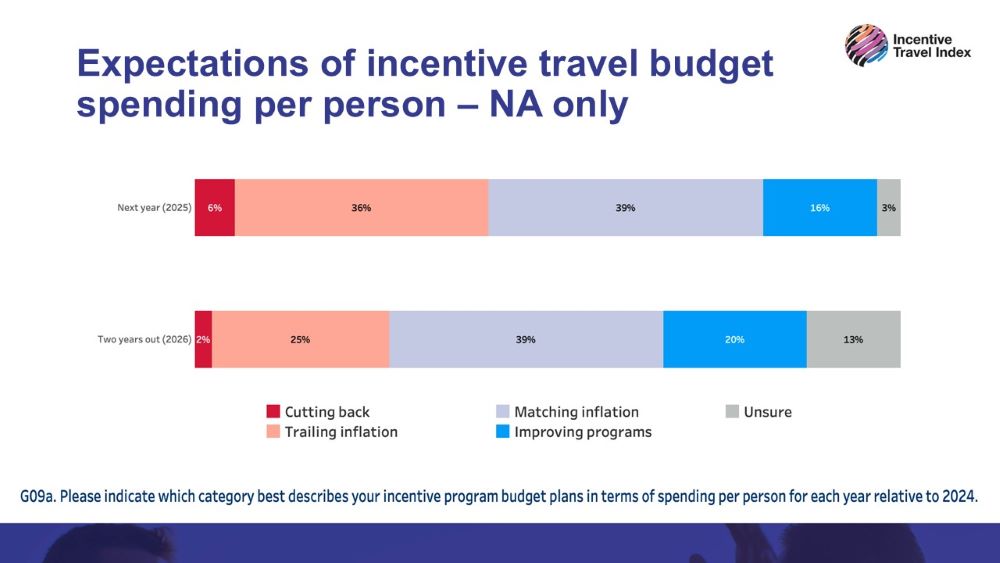
There’s good news! Budgets for incentive travel have continued the growth trajectory ITI results have been seeing since 2020 and are predicted to continue that trajectory moving forward. Only 8% of North American corporate and agency buyers reported decreasing budgets over when comparing 2024 numbers to 2025 projections , and only 6% reported a decrease for 2026, Harris said during the ITI panel discussion.
Many buyers anticipate growth in incentive travel activity and per-person spend over the next two years. By 2026, 45% of buyers expect incentive travel activity to be above or significantly above 2024 levels, with 55% expecting spending increases to match inflation or improve programs.
In North America, specifically, the current budget breakdown is as follows: Hotels account for around 27.5% of total program budgets, with airfare (21%) and F&B costs (18%) claiming spots two and three. Destination experiences and activities represent around 13% of program budgets, while other program elements such as ground transportation, third-party agency fees and gifting represent less than 10% of budget allocations. Additionally, allocations for agency fees have decreased 36% since 2023, having previously accounted for 8.9% of budgets and dropping this year to 6%.
Program Inclusions
The incentive qualifiers we were once planning for look different now, especially as young professionals enter the workforce at an unprecedented pace. (By 2030, nearly 75% of the U.S. workforce will be comprised of Millennials and Gen Z!)
Not only are our attendees changing, but so, too, are their incentive program preferences.
What matters most to incentive program qualifiers and what do they see as the benefits of attending incentive programs and events?
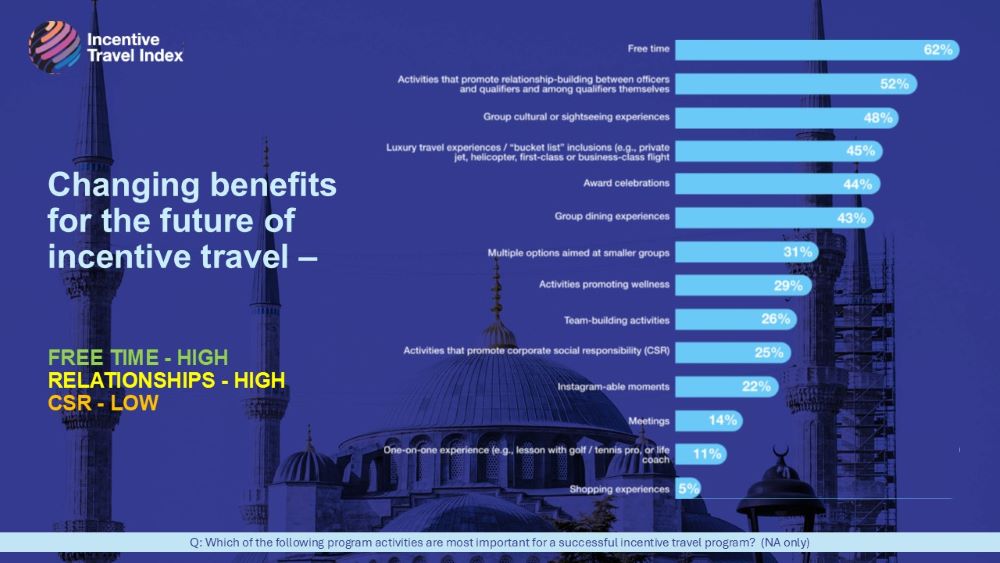
At the top of the list of benefits and program inclusions for North American respondents is free time (65%), followed by activities that promote relationship-building between officers and qualifiers and among qualifiers themselves (53%), and group cultural or sightseeing experiences (47%).
Inclusions such as group dining experiences (43%) and teambuilding activities (24%) that once ranked at the top of a qualifier’s list have now fallen below their top five preferences.
Harris suggested that this shift could possibly be better understood by looking at inclusions and activities as “casual” (networking receptions, activities, destination experiences) versus “forced” (teambuilding, corporate social responsibility, etc.).
In comparison to 2023, where group cultural or sightseeing experiences ranked at the top of the ITI list (100%), followed by relationship-building activities (95%), free time has skyrocketed to the top of this year’s list, and relationship-building activities are trailing behind by 15 points in spot two.
“Obviously, budget is kind of an obvious reason for this,” Myers said. “But looking at attendee preferences, we’ve been seeing this shift, especially as you look at the generational changes with attendees and the audience we’re dealing with. It’s a balance between all the stakeholders for the program—the sales leaders, C-suite, HR—they all want different things out of a program, and sometimes I think we’re trying to accomplish too many different things.”
[Related: Shifting Sands: Luxury Incentives Are Back, With a Twist]
Destination Selection
Buyers around the world are increasingly looking for something new and seeking destinations they haven’t used before (70%). Resorts—both all-inclusive and regular—have gained popularity (42%) while destinations within shorter distances from participant origin should see increased use (40%).
Looking at data from North America specifically, two things stood out: Second- or third-tier destinations with strong resort amenities and short connection times from major markets are poised for significant growth in the next two to three years, and Hawaiʻi is resurging as a top destination.
When it comes to changing destination considerations, planners are considering cost, safety and geopolitical risks before anything else, all showing an increased importance within the 71% to 74% range, while criteria such as perceptions of safety from a health perspective, DEI considerations and lower carbon footprints showed decreasing levels of importance.
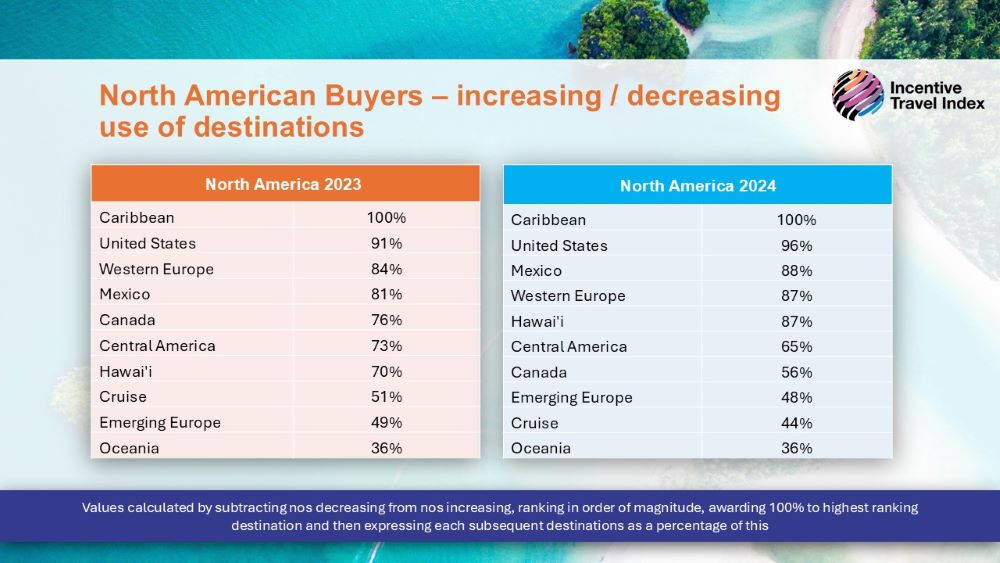
Based on data from North American respondents, the top 10 destinations currently being considered for incentive programs are: Caribbean, United States, Mexico, Western Europe, Hawaiʻi, Central America, Canada, Emerging Europe, Cruise and Oceania.
[Related: How a Tech-Savvy Generation Is Changing Incentive Travel Programs]
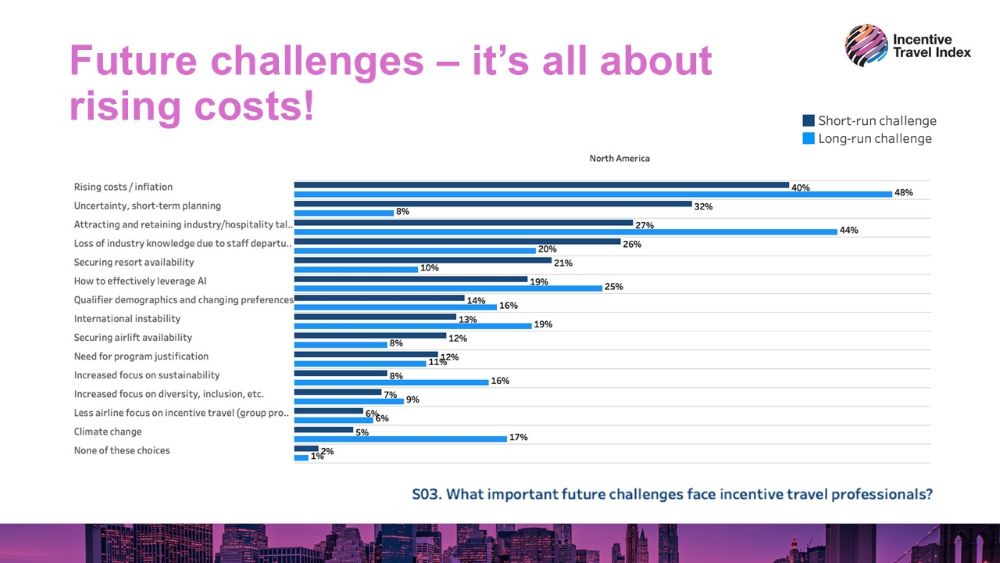
Rising Costs and Other Challenges Ahead
The most cited challenges faced by incentive travel professionals were rising costs and inflation, with 38% of respondents saying rising costs were among the top concerns; 30% of respondents said attracting and retaining talent was another concern. Issues like climate change, sustainability and effectively leveraging AI are expected to grow long-term in the future according to respondents.
Many respondents also see greater risks facing the incentive travel industry in a time of generational change, which is the gradual shift in societal norms, attitudes and behaviors that occurs as one generation replaces another. As baby boomers begin to retire and new generations begin to take their place, 41% of respondents agreed that incentive travel design is lagging in an era of generational change. Additionally, 18% of respondents said that in a few years, long-haul incentives will no longer be justifiable in the context of climate change, further emphasizing the need for the industry to address concerns around sustainability.
Another concern the survey brings up is the increasingly strained relationship between buyers and sellers in the incentive travel market, with 48% of respondents viewing the relationship between buyers and sellers as complex. Many other respondents indicated that the relationships are challenging (38%), uncertain (17%), difficult (13%) and weakened (13%).
However, other respondents said that the relationships are strong (29%), stable (24%) and efficient (14%). But overall, there were more negative sentiments surrounding the supplier/buyer relationships than positive ones, with incentive travel agencies facing increased negative perceptions.
To learn more or download the full report, visit incentiveindex.com.
Read more of the latest news in the meetings and events industry